


 Francais
 Deutsch
 Italiano
Refine Your Search
Vienna Austria 1923 stock footage and images
- Showing 571 to 576 of 702 results more
more Hide
Hide
Petroleum products are filled in containers which are then weighed in the United States.
Uses of different petroleum products in the United States. Petroleum products are distributed and filled in different containers. Men walk on a pathway on both sides of which is heavy machinery. Three men standing on a platform work on the fuel tank of a tank truck. Men fill petroleum products in containers using pipes. The containers are then sealed. They are rolled towards a weighing machine and are weighed. Two men work on machinery. Small containers are weighed and sorted.

Attendants fill gasoline in cars at a service station in the United States.
Uses of different petroleum products in the United States. Two cars at a service station. One of the cars is driven away. Another car pulls in the station. Attendants fill gasoline in the cars. A structure on the top of a pole. A piston in the structure goes up and down.
Men carry out experiments to check the quality of petroleum products in the U.S.
Quality of petroleum products is checked and scientific research for further improvement is carried out in the United States. A man carries out an experiment to check the quality of a petroleum product. He heats the product on a Bunsen burner using a pair of tongs. Then he lights a lamp using the petroleum product. Another researcher looks through a tube at a screen and makes some adjustments. He makes a note on a container and pours in the container. Scientific glass apparatus in a box on a stand. A man looks at them. He makes a note on a paper and takes a look at a paper in his hand.
A map shows main pipe line systems through which crude oil is transported in the United States.
Advancement in transportation of petroleum in the United States. A political map of the United States shows main pipe line systems through which crude oil is pumped underground from producing fields to refineries. Animation on the map shows a pipe line which is under construction.
Total consumption and per capita consumption of petroleum of the United States is compared to that of the rest of the world.
The consumption of petroleum in the United States is compared to that of the rest of the world through an animation. The animation shows the population of the U.S. and the world outside of the United States in the year 1890. The animation also compares total consumption in barrels and per capita consumption in gallons of the U.S. and the rest of the world.
Water flows over the Niagara Falls and a globe with nine circular parallel lines along the equator rotates in the U.S.
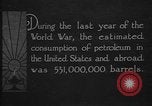
The total consumption of petroleum of the U.S. and the world outside of the United States for the year 1918 is compared. Animation is used for this. Per capita consumption is also compared. Water flows over the Niagara Falls. A globe with nine circular parallel lines along the equator rotates. The 9 circular lines denote that if the per capita consumption of petroleum had increased as rapidly abroad as in the U.S. the world's petroleum requirement in 1922 would have been 10 times the actual requirement and if this volume had been loaded into tank cars of the capacity of 10,000 gallons each it would have made a solid train extending around the world at the equator 9 times.